WTIUSD
The oil market is experiencing volatility due to Israel's attacks on Lebanon and the increase in stock data released by the U.S. Energy Information Administration. Uncertainties in global markets, data on consumer confidence and job postings in the U.S., the Fed's monetary policy, and upcoming elections continue to influence the general direction of the market. In this context, the performance of U.S. and European stock markets is important in determining the direction of oil prices.
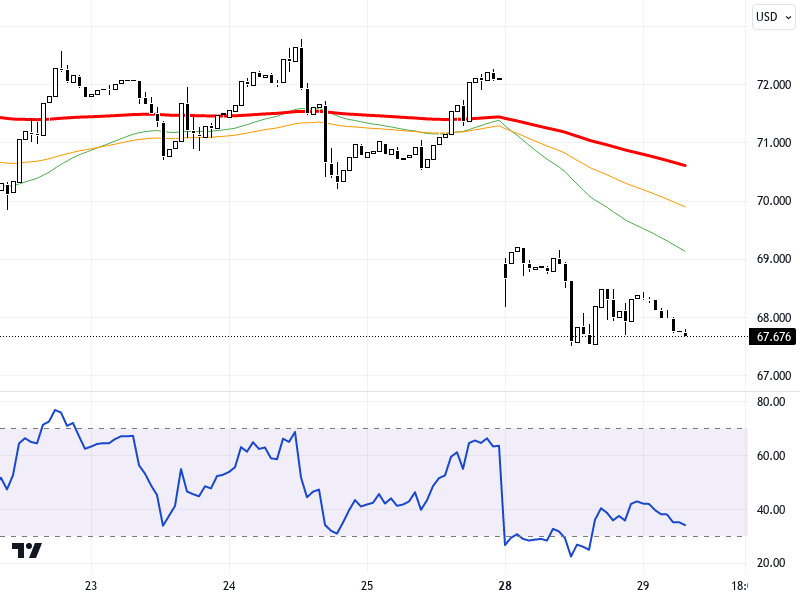
When the WTIUSD chart is examined in the 4-hour time frame, it is observed that the price moves within the 67.00-68.00 range. Currently, the 67.00 level is noted as support, while the 68.00 level is monitored as resistance. The RSI indicator is at 40, presenting a negative outlook. The price has decreased by 1.03% compared to the previous trading day. If the price breaks the 67.00 support, the levels of 66.50 and 66.00 may come into play. However, breaking the 68.00 resistance is important for an upward movement.
Support :
Resistance :


