GBPUSD
The GBP/USD pair exhibits a volatile trend as the October inflation data from the US aligns with market expectations. Notably, despite a slight increase in headline inflation, the rigidity in core inflation stands out. This situation supports expectations for a rate cut at the Fed's December meeting. However, economic indicators to be announced in the upcoming period, such as the PCE Deflator, Nonfarm Payrolls, and November CPI data, may affect Fed expectations and market volatility. Today's focus points include US PPI data and remarks from the Fed and ECB presidents.
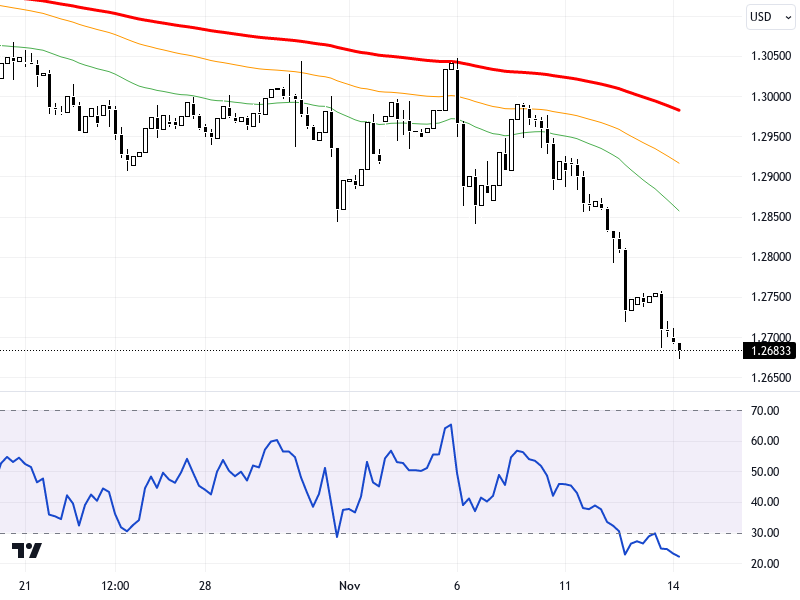
From a technical perspective, the GBP/USD pair is trading below the 1.2820 – 1.2860 region, which corresponds to the 34 and 55-period exponential moving averages. If the pair falls below the August 6, 2024 low of 1.2670, the pressure towards the 1.2600 level is expected to continue. In an upward recovery, movements above the 1.2715 resistance level may be seen; however, if the overall negative trend persists, the selling pressure at these levels will remain significant. The RSI indicator is at the 40 level, showing a negative outlook, and the pair has declined by 0.19% compared to the previous day. Support levels are monitored at 1.267, 1.263, and 1.260, while resistance levels are at 1.2715, 1.278, and 1.282.
Support :
Resistance :


