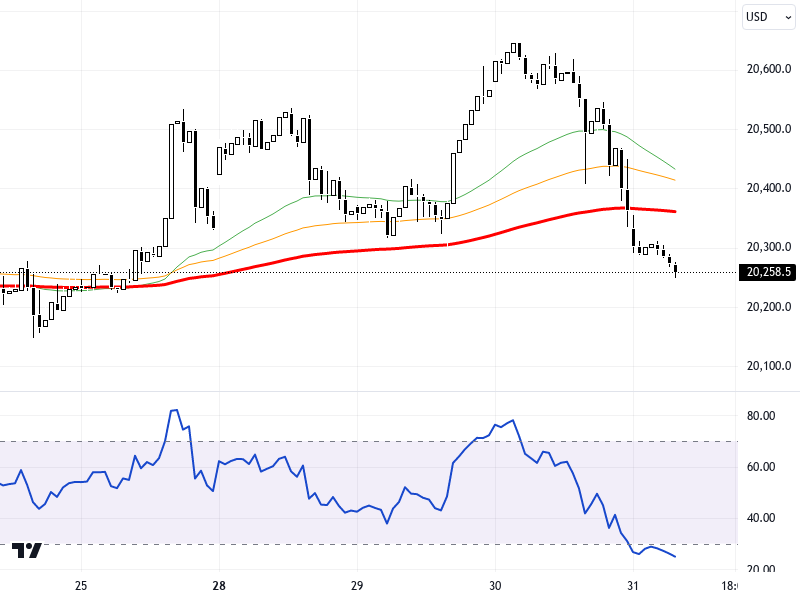
NDXUSD
Although the NASDAQ100 index remains under pressure due to the rise in 10-year U.S. treasury bond yields, Tesla's earnings report, which exceeded expectations, somewhat alleviated this pressure. Throughout the day, claims for unemployment benefits and preliminary services and manufacturing PMI data can be closely monitored. In the U.S., the persistent nature of core inflation indicators is giving support to the dollar. While this situation could create pressure on the NASDAQ100 index, PCE inflation and non-farm employment data might be determining factors for the markets.
When examining the NASDAQ100 index on a 4-hour time frame chart, it is noted to be trading between the levels of 20250 – 20500. The levels of 20350, 20250, and 20150 are monitored as support zones, while 20500, 20680, and 20800 levels stand out as resistance zones. The RSI indicator is at the level of 45, showing a negative outlook. Compared to the previous day, the index has experienced a decrease of 0.52%. In light of this data, it can be said that the index is at a decision stage based on its technical outlook.
Support :
Resistance :


