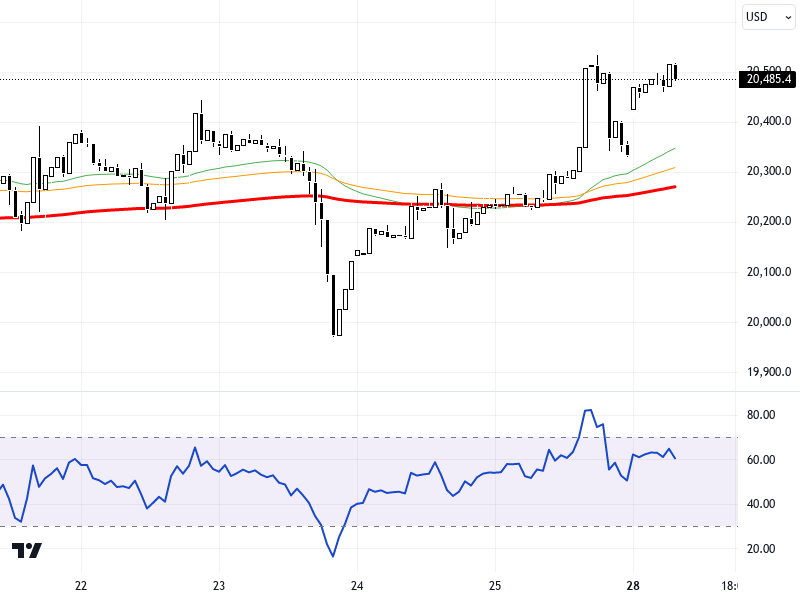
NDXUSD
The NASDAQ100 index continues to be under pressure due to the rising 10-year treasury bond yield. However, Tesla's better-than-expected financial results have somewhat limited this pressure. Applications for unemployment benefits and preliminary service and manufacturing PMI data during the day could determine the index's direction. The positive trend in Asian markets and the weakening of the yen in Japan might affect global economic expectations. Economic data from the US and the Eurozone could also create new pricing movements in the markets.
In technical analysis, the NASDAQ100 index is trading in the 20250 - 20500 support zone. For the index observed on a 4-hour time frame on the chart, the RSI indicator is at the 45 level, presenting a neutral outlook. In upward movements, if permanence above the 20500 level is achieved, 20680 and 20750 resistance levels may be targeted. In downward movements, falling below the 20250 level could bring the 20150 and 20000 support zones into focus. The index is down by 0.75% compared to the previous day.
Support :
Resistance :


