NGCUSD
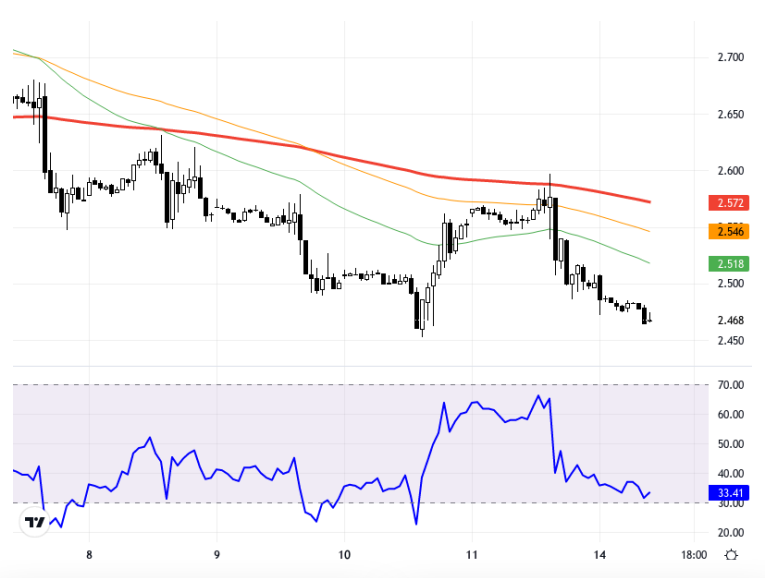
In the NGCUSD pair, expectations of weakened natural gas demand following Hurricane Milton and developments in global markets are being monitored. While the performance of European and US stock exchanges is significant, staying below the 2.610 – 2.650 resistance levels could increase downward pressure. In potential declines, the 2.540 and 2.505 support levels could be targeted. In an upward recovery, surpassing the 2.610 – 2.650 resistance band will be crucial. However, unless stability is maintained in this area, new downward pressures may arise. When examining the chart in a 1-hour timeframe, it is traded at the 2.479 level. For upward movements, the 2.540 level and subsequently the 2.574 resistance levels should be monitored. If the downward trend continues, the 2.475 and 2.449 levels may provide support. The RSI indicator is at 35.75, displaying a negative outlook. There is a 0.16% decrease compared to the previous day. The current price is at the 2.468 level. Support:2.44 - 2.41 - 2.38 - Resistance:2.505 - 2.54 - 2.58 -
NGCUSD paritesinde Milton Kasırgası sonrası doğal gaz talebine yönelik zayıflama beklentileri ve küresel piyasalardaki gelişmeler izleniyor. Avrupa ve ABD borsalarındaki performans önem arz ederken, paritenin 2,610 – 2,650 direnç seviyeleri altında kalması, aşağı yönlü baskıyı artırabilir. Potansiyel düşüşlerde 2,540 ve 2,505 destek seviyeleri hedeflenebilir. Yukarı yönlü toparlanmada ise 2,610 – 2,650 direnç bandının aşılması önemli olacaktır. Ancak bu bölgede kalıcılık sağlanmadıkça yeni düşüş baskıları gündeme gelebilir. Grafik 1 saatlik zaman diliminde incelendiğinde, 2,479 seviyesinde işlem görüyor. Yukarı yönlü hareketler için 2,540 ve devamında 2,574 direnç seviyeleri izlenmeli. Düşüş eğilimi devam ederse, 2,475 ve 2,449 seviyeleri destek oluşturabilir. RSI göstergesi 35.75 seviyesinde olup, negatif bir görünüm sergiliyor. Önceki güne göre %0.16 oranında bir değer kaybı mevcut. Güncel fiyat ise 2.468 seviyesinde. Destek:2.44 - 2.41 - 2.38 - Direnç:2.505 - 2.54 - 2.58 -


