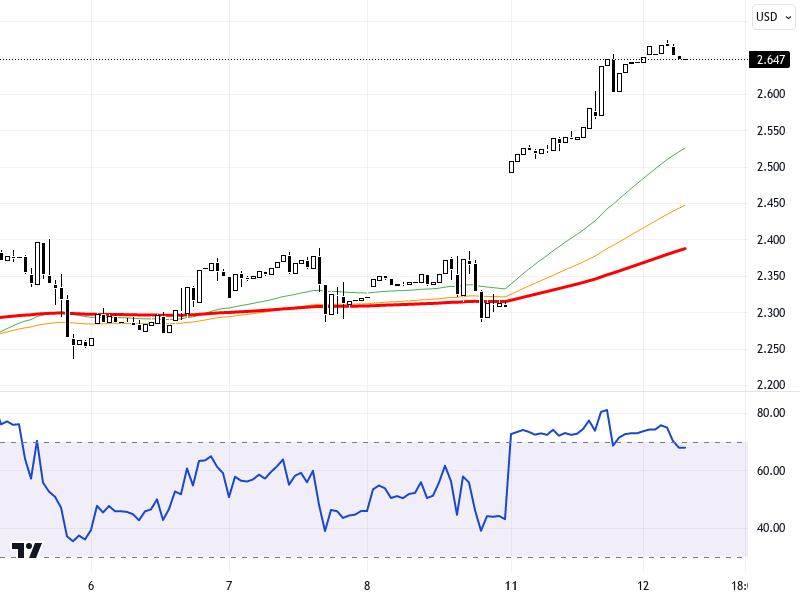
NGCUSD
U.S. natural gas futures started the week strong as Hurricane Rafael significantly impacted natural gas production in the Gulf of Mexico. This rise due to the hurricane led to a temporary calm in price movements in the markets. However, the trajectory of European and U.S. stock exchanges may create new movements in prices. The decline in Asian indices and the uncertainties in the markets due to Trump effects could also impact energy markets.
According to the current chart data, when the NGC/USD pair is analyzed on the daily chart, it is observed that the price is at the level of 2.647. In upward movements, the price could potentially rise toward the resistance levels of 2.94, 2.97, and 3.00. In downward movements, the support levels of 2.88, 2.85, and 2.82 may be monitored. The RSI indicator is at level 40 and is showing a negative trend, which could indicate that the downward pressure may continue. Prices have decreased by 0.11% compared to the previous day, indicating that the downward pressure continues to persist in the market.
Support :
Resistance :


