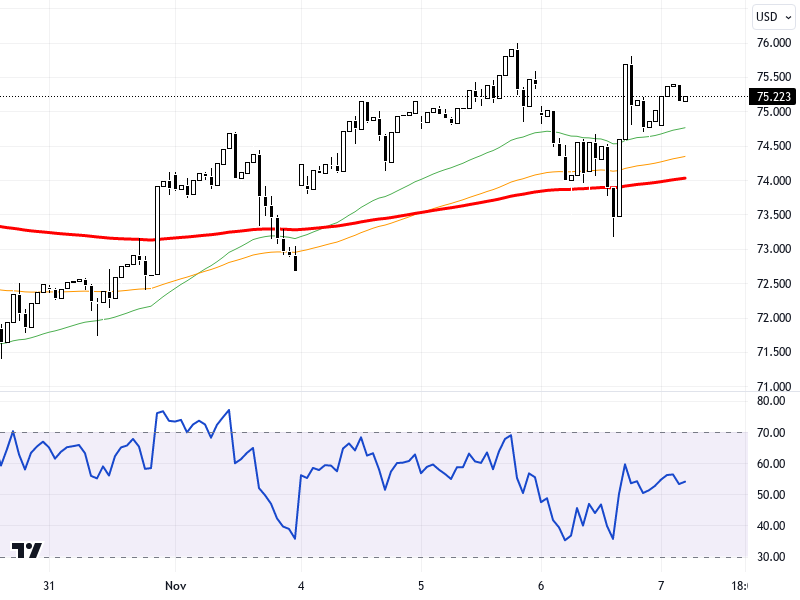
BRNUSD
In the oil market, the tension between Israel and Lebanon is causing an upward trend in prices. This situation contributes to the market's upward movement despite the stock increase data announced by the U.S. Energy Information Administration. The trend of the European and U.S. stock exchanges may also influence oil prices. The mixed picture in Asian markets post-Trump creates uncertainty in global markets, while monetary policy statements from the U.S. and U.K. central banks are being closely monitored.
Technically, when examining price movements on the BRN/USD chart in a 4-hour time frame, the levels of 71.5, 71, and 70.5 are monitored as support. For upward movements, the resistance levels of 72.5, 73, and 73.5 are significant. The RSI indicator is around the 60 level, presenting a positive outlook. Prices have increased by 0.29% compared to the previous day, and the upward trend may continue. However, if the price falls below the 74.5 level, the potential for a decline may strengthen.
Support :
Resistance :


